US West Cost might have the slower internet in US
Internet connection speed varies according to different geographic areas.
The fluctuations on the average peak of internet speed depend on many factors like the type of connection, your services provider, and the area where you live.
Akamai Technologies is a content delivery network company that is responsible for the administration of 15% to 30% of the world web traffic, and they measure the differences between internet speeds in the distinct countries around the world to inform users where to find the best connections.
Akamai’s global distribution allows it to collect massive amounts of data measuring the internet speed, the telecommunications coverage, and the network connectivity.
The company issues a quarterly report on the state of the Internet with up to date information gathered by their intelligent platform from different countries around the world.
In their last published report, they measured the differences in internet speed in each state of the United States of America.
This report revealed that the connection with the best internet speed in the USA is in the District of Columbia with an average peak of 93.0 Mb/s, followed by Delaware with 92.2 Mb/s, Massachusetts with 86.2 Mb/s, Virginia with 84.9 Mb/s, and Maryland with 84.5 Mb/s.

Source: Akamai report
To further illustrate, here’s a heat map where the red spots are the states with a higher internet speed, while the green and yellow ones indicate the places where the connection speed decreases.
Why is the average peak of internet speed measured?
The average peak of internet speed is the highest number in an average table. It is used in Akamai's report because this number determines the potential of the connections in the area.
In order to issue this statement, Akamai measured the connection speed of different IP addresses using an internet speed tester that allowed them to calculate the average peak of internet speed in a specific area.
Bear in mind that this statement represents the average connection speed which means that if you execute an internet speed test on your own, your connection just might be faster or slower than the average peak.
What affects the speed of internet connection?
Several factors affect the speed of your internet connection.
In this case, we are not talking about things like your router version or the type of Ethernet cable you use, but rather major aspects that definitely have a bearing on the issue like telecom infrastructure or your services provider.
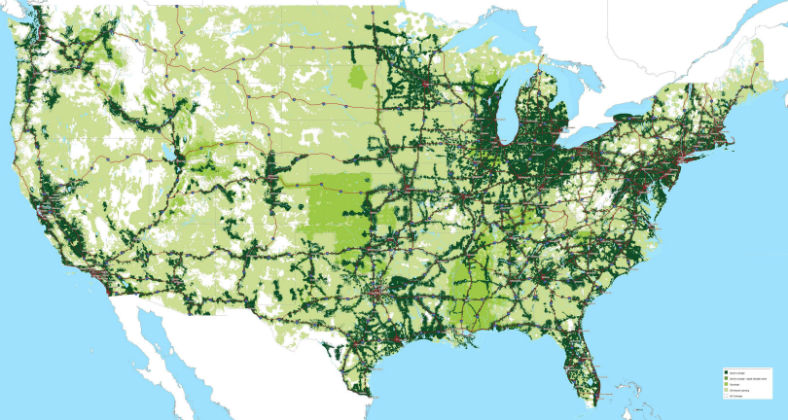
Map of telecom companies different areas of coverage.
In the United States, there are a vast amount of telecommunication companies offering internet services but we decided to analyze the infrastructure of four of the major corporations.
What we have is a comparison table between AT&T, Verizon, T-Mobile, and Sprint, with a map of their coverage areas throughout the country.
The maps presented show the covered area of the 4G speed offered by the different telecom corporations analyzed.
 |
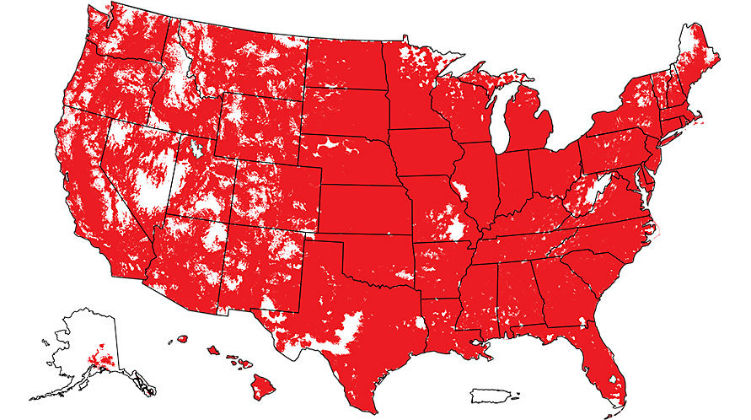 |
Left: AT&T coverage area. Right: Verizon coverage area. (Souse: theverge.com / verizonwireless.com)
 |
 |
Left: Sprint coverage area. Right: T-Mobile coverage area. (Source: imgur.com / howardforum.com)
The result is similar in each case.
Think about it:
the majority of the infrastructure is located towards the east side of the country so internet traffic and speed are superior in that area while states like Mississippi, New Mexico, Arkansas and Kentucky have the lowest average internet speed as indicated in Akamai’s report.
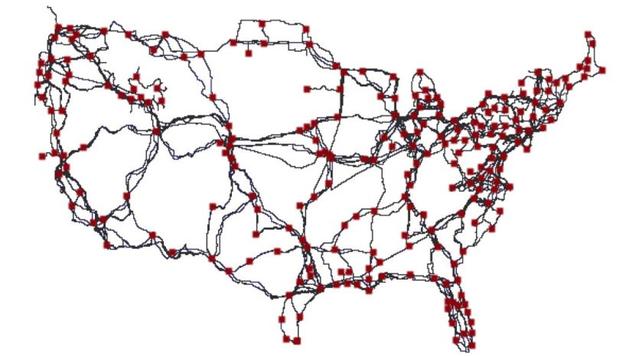
The construction of a fiber map
Optical fiber is the technology of the future and every major telecommunication company knows it, for that reason the infrastructure builds on this material increase every year.
A paper resulting from the study of the long-haul fiber optic infrastructure was written by Ramakrishnan Durairajan, Paul Barford, Joel Sommers and Walter Willinger, a group of college professors.
They spent more than four years making the necessary structure to construct the map using data from several major North American telecommunication companies like AT&T, Comcast, Cogent, EarthLink, Integra, Level3, Suddenlink, Verizon, and Zayo. It was far from easy but they ultimately reached their goal.
Source: voanews.com
They verified the information using a geocode location and improved the map by aligning both data results.
Once all this was done, they were able to construct the first map of the entire fiber telecommunication infrastructure in the United States.
This map gives us some interesting information unrevealed till now.
There are 542 fiber optic conduits located in the USA and many of them are shared by different telecommunication corporations, according to this investigation.
Some of the most notable cases are 12 different conduits shared by more than 17 Internet Services Providers.
One of the most notable cases is that of 12 different conduits shared by more than 17 Internet Service Providers. The publishes research explains that this situation is found in conduits located in major population areas like Phoenix, Denver, Philadelphia or New York.
But this is just part of the history…
This situation represents a major risk for the country’s entire telecommunications network.
Imagine there should be a problem with one of those shared conduits or an attack to the connections in that particular place.
That would mean at least 17 providers would be virtually unconnected, and several cities would end up without any sort of telecommunication system.
The publication of this paper questioned the distribution of the telecommunication industry and if it should be changed.
The dark fiber map reveals the inactive telecom infrastructure

As you may now know, optical fiber structures are in constant expansion and conduits are being continuously installed and connected if not used.
Dark fiber is a term for that optical fiber infrastructure that hasn’t been lit yet, which means that the conduits are installed but are not being used.
This inactive fiber has become a source of income for the telecom industry.
The companies that own these conduits rent the dark fiber to local content providers, institutions or agencies that are in need of a private network are thousands and thousands of miles of dark fiber distributed throughout the United States that can offer a bundle of benefits to the companies that acquire them.
Starting from the fact that they do not need to invest in the infrastructure or the construction of the communications network.
It’s already been done.
Another benefit is that the network will be a private one, offering better quality connections.
Now, in order to have access to a dark fiber structure, clients must pay a fee to the companies that own the conduits. They more or less lease the service for different periods of time that can go from one year to twenty.
The telecommunications industry is growing all over the world, and new and better infrastructure installations are being constructed on a daily basis.
In a short period of time, these maps will change and perhaps communication networks will once again redefine our reality.